Date:
Monday 20th October 2025
Share:
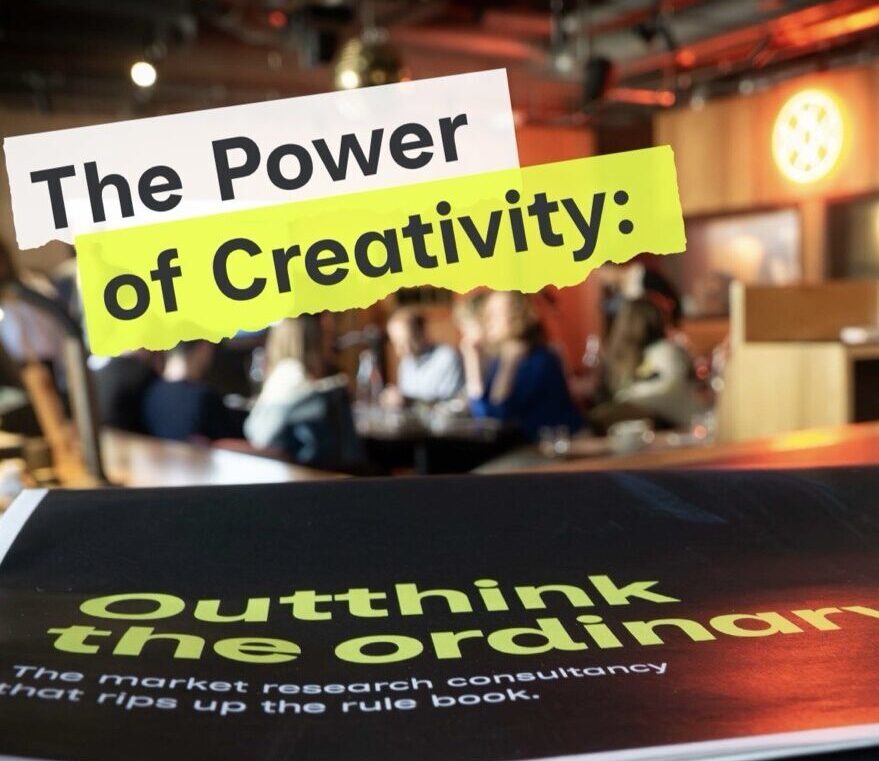
“I’m not a very creative person.” Mark James, CEO, Differentology
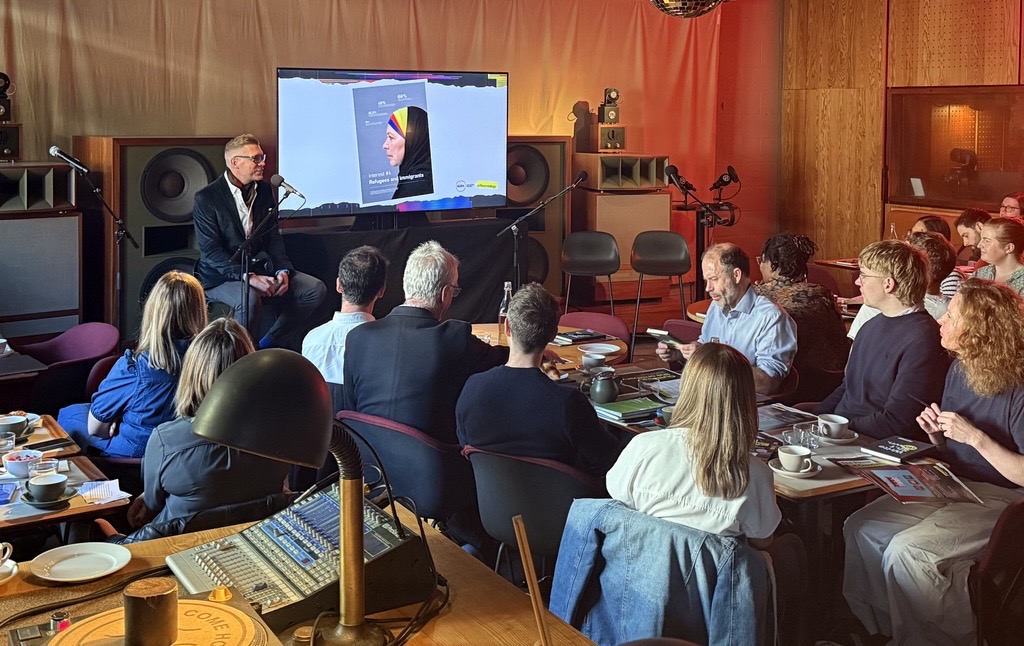
The confession our CEO Mark James often opens with. Those of you who joined us at our recent event with AURA, would have heard exactly this line, when he opened proceedings to welcome our guests!
It might sound like an odd thing for someone leading a research agency to say, but it’s precisely where the Differentology story begins.
Mark’s background is in quantitative research. Numbers, data, statistical models. Not drawing, painting, or copywriting. In his own words:
“I can’t draw, or paint, or write… to save my life! I have next to zero artistic talent.”
But when Differentology was founded, Mark didn’t try to force creativity out of spreadsheets. Instead, he looked outside the traditional world of research for inspiration and found it in an unlikely place: the world of advertising.
Inspired by Mad Men
The glossy world of Mad Men wasn’t just compelling TV; it was a revelation. Mark began bringing in people from the advertising world:
Copywriters. Art Directors. Photographers. Animators. Videographers.
People who weren’t just focused on understanding insights but expressing them in a way that grabs attention and stirs emotion. It was a mashup of opposing mindsets; analytical meets creative. Numbers meets narrative.
And it worked.
The Power of Collisions
As researchers, we dig through mountains of data to uncover hidden truths. As creatives, we turn those truths into stories that make people feel something and act.
The real magic happens when these two worlds collide.
There’s one image in particular that captures this magic more than any other.
The Image That Changed Everything
Over 15 years ago, Mark discovered an infographic by Danish artist Peter Orntoft and it changed how he thought about presenting research.
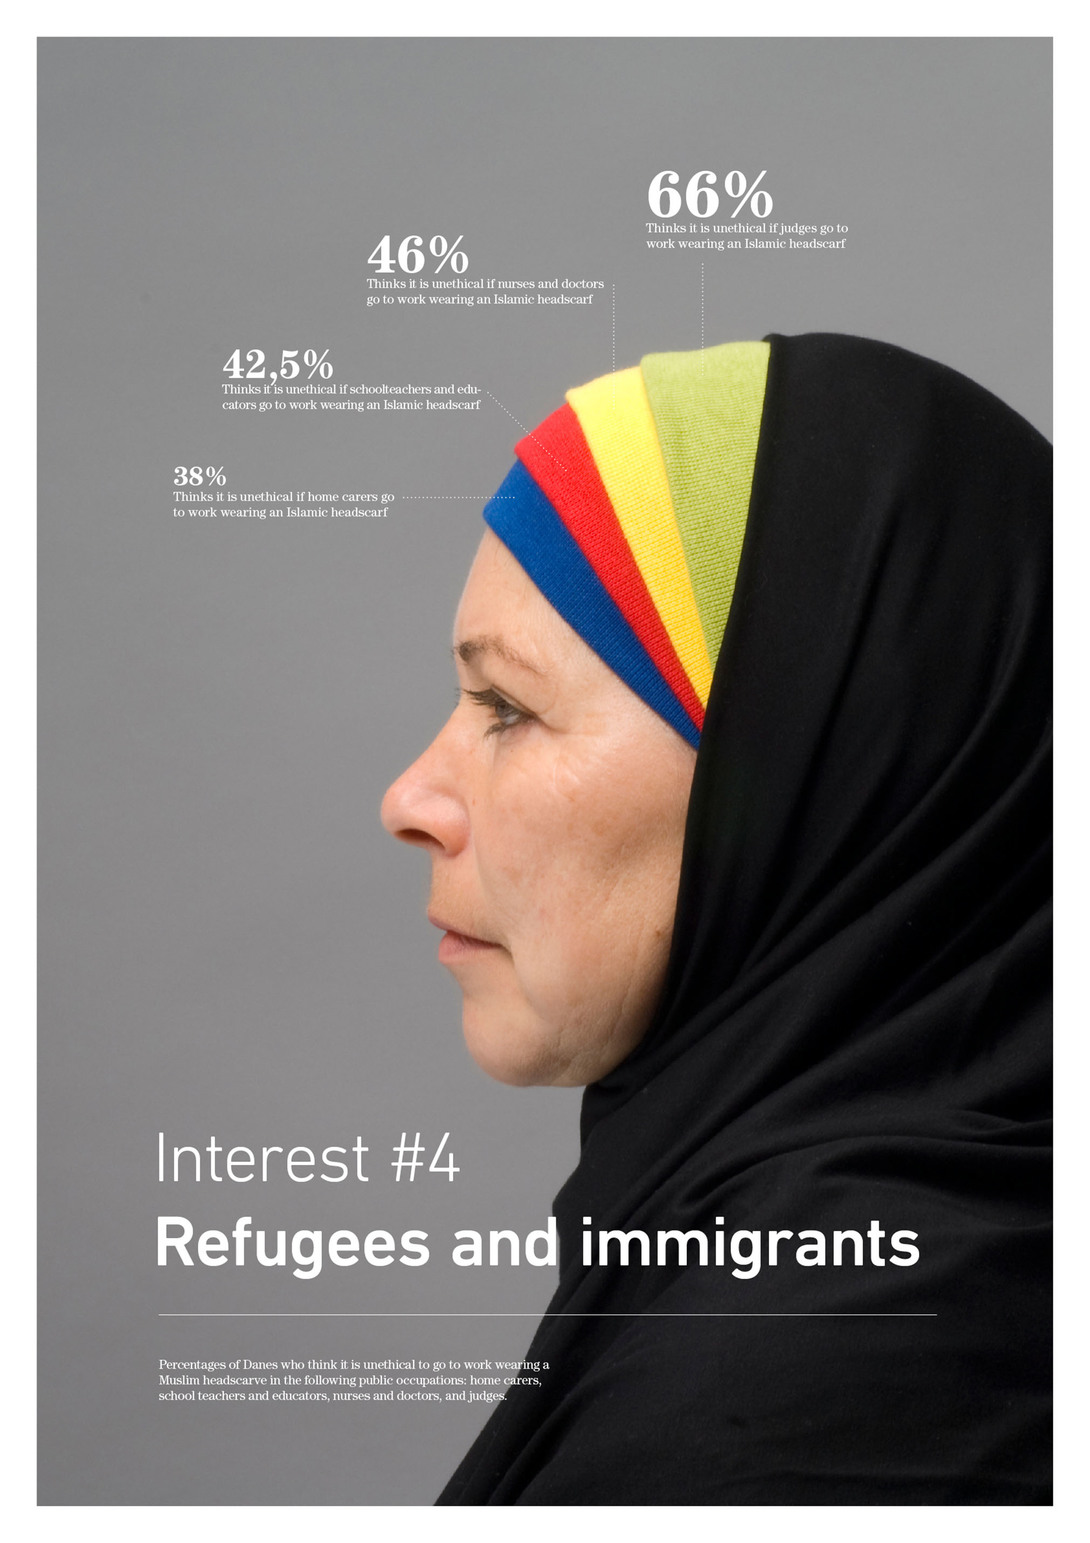
The image visualises the results of a survey conducted in Denmark, asking citizens whether it is unethical for women to wear Islamic headscarves in various public sector jobs. The results are powerful and so is the visual.
Rather than a basic pie chart, Orntoft uses photography, symbolism, and design to give the data emotional weight. The subject’s expression, the layered colours of the headscarf, and the cold, stark statistics; each element works together to tell a story.
It’s not just informative. It’s unforgettable.
This is what happens when research breaks away from the traditional presentation formats.
What We Took From It
That image became a cornerstone of how Differentology thinks. It inspired us to stop thinking of research outputs as “deliverables” and start treating them as experiences.
Why It Still Matters
 At Differentology, we don’t believe in choosing between creativity and credibility. We believe in both. And we believe that the best insights come not just from digging deeper, but from seeing differently and allowing ourselves to Outthink the Ordinary.
Want to know more? Drop us a line!